PA imaging has a potential to sense the electrophysiological state of biological tissue. Voltage sensitive dyes are designed to monitor membrane potential by detecting fluorescence changes in response to neuronal or muscle electrical activity. Through our collaboration with Prof. Les Loew (University of Connecticut) who pioneered VSD synthesis, we have reported the first PA VSD imaging system, and we did identify, quantify, and report the reciprocal relationship between PA thermal yield and fluorescence yield of the VSD. We have validated this technology using a seizure model in mice, visual cortex excitation in mice and piglets, and snout stimulation in piglets. For example, the functional PA VSD imaging of light perception on rodents was performed to prove its feasibility (Figure 1).
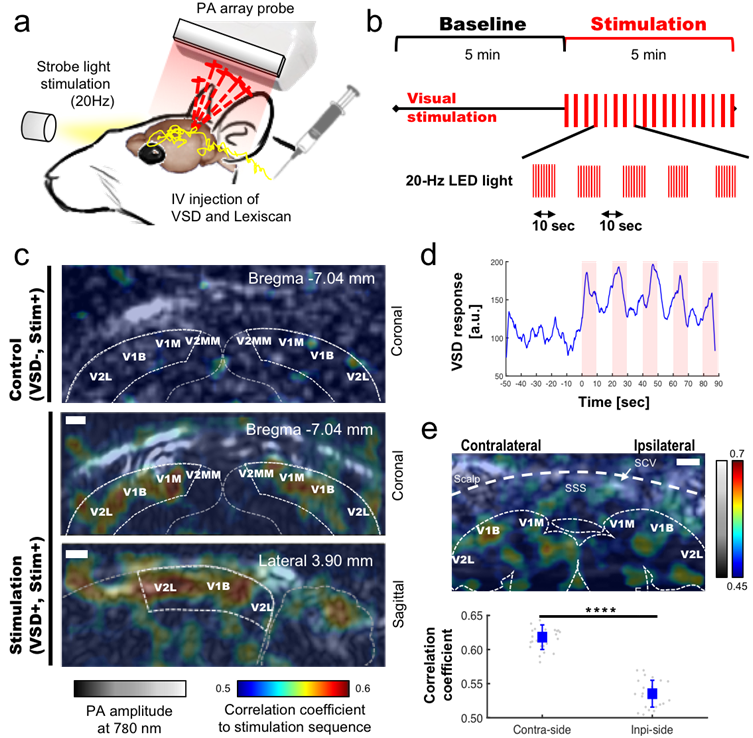
The 20-Hz strobe light was binocularly excited with 10sec intervals between ON/OFF phases, and coronal visual cortex at bregma -7.04 mm was monitored by our functional PA imaging (Figure 1a/b). The pixel-by-pixel temporal correlation between VSD response and stimulation sequence in spatial domain exclusively highlighted visual cortex regions in both coronal and sagittal planes, whereas a control group without VSD injection presented no such correlation level (Figure 1c). At the specific visual cortex region with high correlation, the VSD response trace was well correlated to the stimulation sequence in the temporal domain (Figure 4d). The monocular stimulation was also conducted (bregma -9.16 mm, Figure 4e). The correlation coefficients measured from contralateral and ipsilateral visual cortex regions presented significant difference, i.e., 0.62±0.02 vs. 0.54±0.02, respectively. The results present sufficient feasibility of functional PA VSD imaging to visualize electrophysiological visual cortex dynamics in vivo.
Publications
- Zhang HK, Yan P, Kang J, Abou DS, Le HN, Jha AK, Thorek DL, Kang JU, Rahmim A, Wong DF, Boctor EM*, Loew LM*. Listening to membrane potential: photoacoustic voltage-sensitive dye recording. J. Biomed. Opt. 2017;22(4):045006; *corresponding author.
- Kang J, Zhang HK, Kadam SD, Fedorko J, Valentine H, Malla AP, Yan P, Harraz M, Kang JU, Rahmim A, Gjedde A, Loew LM, Wong DF, Boctor EM. Transcranial recording of electrophysiological neural activity in the rodent brain in vivo using functional photoacoustic imaging of near-infrared voltage-sensitive dye. Frontiers in Neuroscience 2019; 13:579.
- Kang J, Kadam S, Elmore J, Sullivan B, Valentine H, Malla A, Harraz MM, Kang JU, Loew LM, Baumann M, Grace A, Gjedde A, Boctor EM*, Wong DF*. Transcranial photoacoustic imaging of NMDA-evoked focal circuit dynamics in rat hippocampus. Journal of Neural Engineering 2020; 17: 025001; corresponding author.